Birdata has moved to a new platform, and some of the information below may be out of date or in need of quality control. Please hold tight while we update this in the coming weeks. In future, we will be doing a full refresh of this content. An updated page is nearly ready, and will be published in February.
We are constantly looking at ways Birdata can be improved – how to make it easier for you to record, store and explore our birdlife, and how to best collect the information needed to protect our native birds and their habitats. Below is an overview of some of our recent updates, and how you can put them to best use.
Just like the birds, Birdata has moulted into some bright new plumage. But not only does our homepage now look different, we’ve added some new information and user-friendly functions too. You can still access the familiar Birdata functions via the tabs at the top of the page, so hopefully things shouldn’t be too difficult to find.
Here’s the highlights, from the top of the page down:
- Big, clickable buttons to get you straight into submitting new records, viewing your older sightings or exploring the entire database.
- A suite of news items – including stories drawn straight from the data, highlights about new programs or new conservation initiatives, stories of great first encounters and new birding spots, tips and tricks to get the most out of Birdata, and some answers to some common ID questions.
- Survey stats from across the country, including top observers from your area. When you are logged in, you’ll be able to see an overview of your survey statistics as well, like what your life and year lists are sitting at.
- Live reporting on featured species – showing how some of our most-loved birds are tracking based upon up-to-the-minute data.
The photos are thanks to the skilful members of the BirdLife Photography group. The data displayed comes straight from your valuable Birdata sightings, and the stories have been compiled by our staff and volunteers. Any feedback, or suggestions for additional features, please don’t hesitate to get in touch at birdata@birdlife.org.au
In order to map the impact of the recent fires on our native birds and their habitats, we’ve added a Bushfire Assessment feature to our Birdata surveys. The next time you go birding with Birdata, please include a Bushfire Assessment in your survey.
How to use the Bushfire Assessment feature
On the mobile app | On the website |
About the Bushfire Assessment feature
The 2019/2020 bushfire season was heartbreaking and unprecedented, and for many of us, there was little we could do but watch on in horror and give thanks to the brave men and women working hard on the front lines to save what they could.
Now that the smoke has cleared, we are working in earnest to understand the full impact on our birds and what it means for our long-term conservation planning.
With thanks to WildlifeLink for their generous gift to support this undertaking, BirdLife Australia is pleased to announce that we have added a new bushfire assessment feature to Birdata.
We’re asking you to help us map the impact of fire on our birds and their habitats.
With the Bushfire Assessment feature, you can provide high level data on:
- bushfire extent
- bushfire intensity
- presence of supplementary feeding
This data is invaluable and will provide crucial information about bird population trends and species’ conservation status.
The bushfire assessment feature is optional, easy to use, and can be done in under a minute.
It is integrated into the existing survey process, so there is no disruption to your usual routine.
Regardless of how and where you choose to survey, please follow advice from the relevant authorities when accessing any outdoor areas that may be closed due to the potential for COVID-19 transmission, stay local, and remember to remain at least 1.5 metres away from other people while you’re doing your birding.
App & Browser
The new bushfire assessment feature can be used in the browser and the app. To access it, open the app or website as normal and follow the usual steps to start entering survey data. When choosing a Birdata program, choose either General Birdata or Birds In Backyards. You will find the tool on the “Survey Details” screen.

Figure 1: When using the app, simply tap on the new “Bushfire Assessment” field to start adding data about the bushfire effects on your chosen survey site. Similarly, if you’re using the web portal, click the “Record bushfire assessment” toggle to get started with your bushfire assessment
Shared and Personal Sites
We encourage you to undertake a bushfire assessment anywhere you wish, whether that survey site is new or an old favourite. This might include sites you haven’t visited for years but which you suspect have been burnt in the past bushfire season.
Survey locations can be a personal site, such as your own backyard or property. When surveying a new personal site, please use a standardised survey type such as a 2ha, 20 minute survey or a 500m area search.
Users are also encouraged to survey at Shared Sites that are part of our national monitoring network. These are specific public sites that are particularly important to our understanding of bird population trends. More information can be found at our Share Sites webpage.

Figure 2: On our Shared Sites webpage, you can filter to show only those sites affected by fire
Most Shared Sites are identified in purple on the location map screen, except those that we know or suspect were affected by bushfires. Those sites are indicated in red. We will be updating known bushfire affected sites as more data comes in.
Some areas remain unsafe or closed due to damage caused by bushfire. If you are uncertain about being able to access your planned site, please check with the local authorities before doing so. As always, your safety is paramount to us!
Happy birding and stay safe,
The Birdata Team
The main Explore page now shows a colour-coded indicator where surveys have been undertaken in the last 14 days (blue) or older (red) (see figure below).
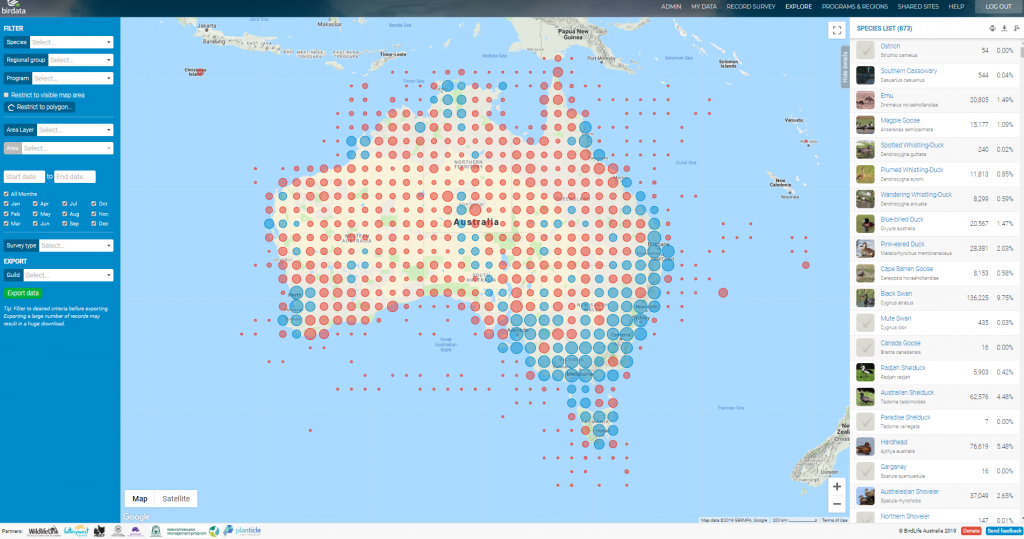
This functionality applies to individual species as well, allowing you to see where a particular species has been seen recently (see figure below). Hover your mouse over a map symbol to reveal how many surveys have been undertaken in a given area.

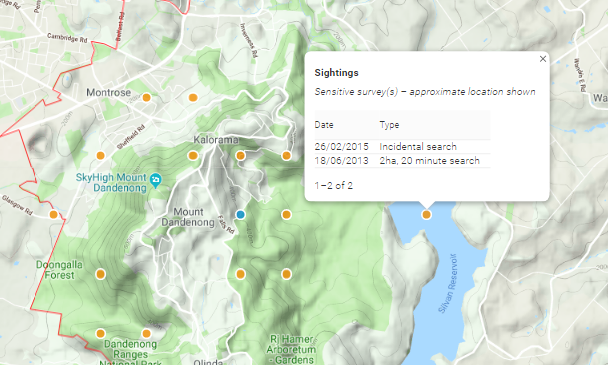
Much like before, survey information in Explore is displayed on a grid until you zoom in far enough, at which point individual survey points become visible. Survey locations that show up in yellow at that point indicate these are surveys where sensitive species have been recorded and for which exact coordinates are de-sensitised. You can now also turn all data on/off or specify individual months at the click of a button.
As of this update you will be able to click on individual survey points to see what has been recorded there and when (see figures below). Clicking on the date in the pop up provides an overview of that survey list. The site name also has a quick link to Google Maps, allowing you to check out the wider area quickly. This provides a more convenient way for you to explore the birdwatching locations near you.
However, the flipside of this is that it will change the way your data is displayed on Birdata, and what elements of it are visible to others. We take your privacy very seriously, which is part of the reason why we are notifying you of these changes. Note that regardless of these changes, observer names are not visible to general users.
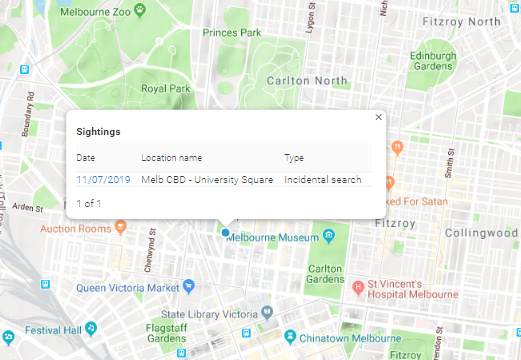
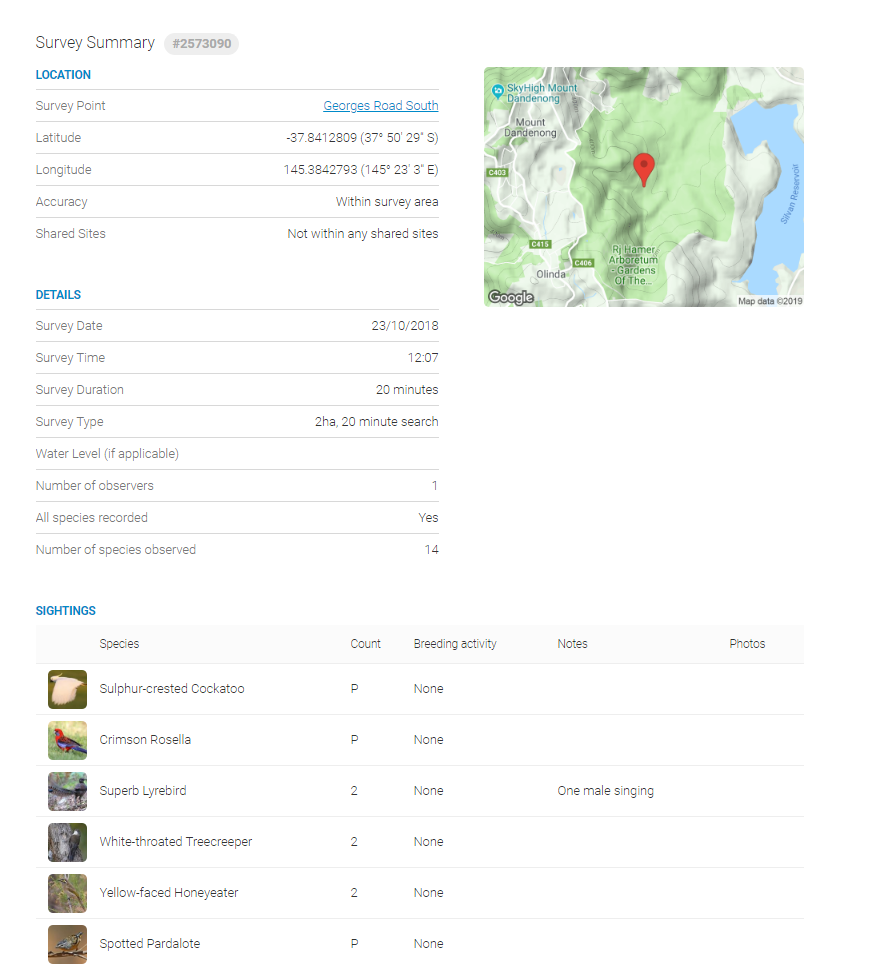
Clickable survey functionality naturally opens up a can of worms when it comes to where sensitive species are found. To balance sensitivity and the ability to explore data, sensitive records allow inspection of survey date and type, but not currently the survey summary (see example below where the user is looking at Powerful Owl records).
You will notice that when you Record Surveys on the web portal, when on the Details page, you now have the option to make surveys private. This will hide both the survey location and species list from other users. For example, you might want to make a survey private when you are on private land or conducting surveys as part of your work or you are using your own street address for regular surveys. If you have existing surveys that you prefer be private, you can also use the Edit function on the My Data to make those changes. However, don’t forget that one of the aims of Birdata is to Explore current and historic data for all users and as such we hope individual users apply the ‘private’ option with some restraint. If you have more than a few past surveys that should be made private we can help you out.
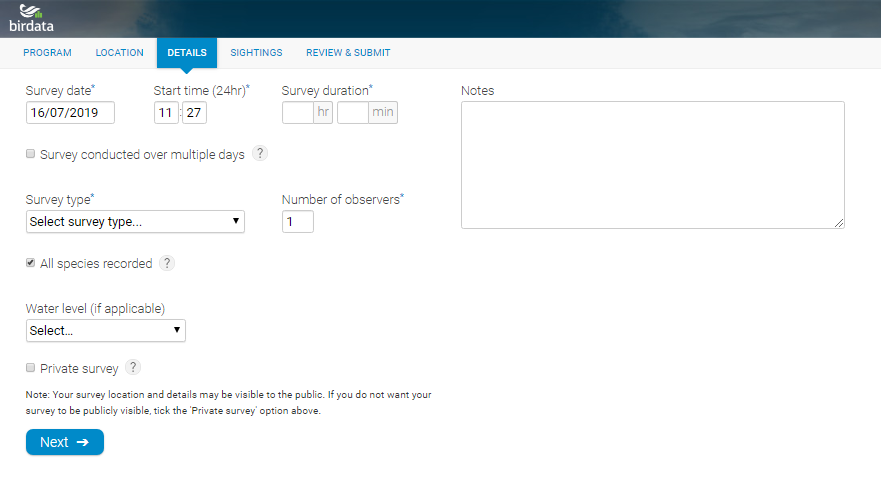
Most things won’t change as a result of clickable surveys – information from private surveys will remain stored on the Birdata platform – we do not pass on your personal information. They will still be accessible to you like the rest of your data and most definitely are valuable to us as we work to monitor and protect our birds. But the specifics of these private surveys just won’t be visible to other users.
Note that surveys that already contain sensitive data – observations of endangered species and breeding birds will still have the same protections they always have: i.e. there is a shortlist of species of conservation concern for which coordinates are by default de-sensitised to different spatial levels and breeding records for parrot and cockatoo species sensitive to poaching continue to be hidden altogether. Where we pass on species lists to publicly accessible third-party platforms such as the Atlas of Living Australia we only provide de-sensitised data for sensitive species. In other words: the private option is not a replacement of Birdata’s sensitivity policy.
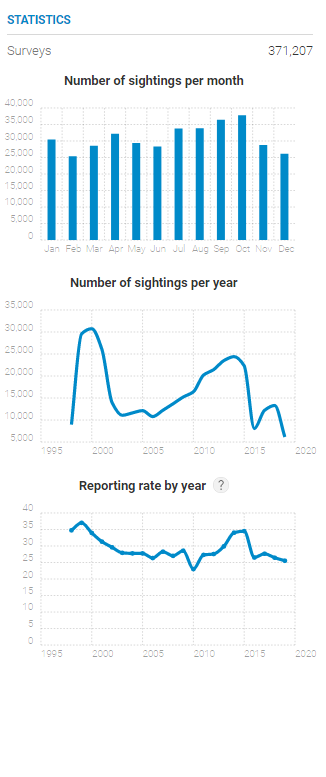
In Explore, when selecting a particular species you will now see 3 different graphs appear: the already existing annual and seasonal graphs as well as a reporting rate graph (see example below).
As these are essentially raw reporting rates we have put some limits to these to avoid hugely superfluous results. Reporting rates are based on structured surveys only (i.e. excluding bird lists and incidentals) and are only calculated for a given year if a minimum of 30 surveys is present in the area the user is looking at. Note that at best reporting rate trends are high level indicative and do not necessarily reflect exact population trends – results should be treated with caution.
Through using different filters (e.g. KBAs, area layers, LGAs) all graphs are automatically recalculated. Hovering your mouse over a graph will download the graph data, enabling users to recreate these for their own purposes.
We’ve made a few changes to the layout of the Birdata portal. For one, you’ll notice the old Programs and Regions tab has disappeared. However, all the things you could do on that tab you can now do on the Explore page. You’ll also notice that all the ways you can filter the data (i.e. by month, by species, or by applying a some different geographical layers) can be made on both the My Data and Explore pages. Also, a small change, but one that has been requested often is a filter to check your species lists at the LGA level. Just go to the Area Layer dropdown, select Local Government Areas and start typing the LGA name.
Quite possibly less exciting to the general user, but adding another layer of sensible management of sensitive areas and species is the admin-only introduction of a sensitive area layer, allowing Birdata to set sensitivity levels for areas such as indigenous lands, particular reserves, airports, military zones etcetera. In conjunction with existing policy surrounding sensitive data and the new private survey option we feel we are doing everything we can to both allow people to engage in birding, monitoring and bird conservation while at the same time making sure data access does not lead to unfettered access of key locations in important areas or sensitive species in general.
